Numbers
Numbers shows every figure your brand's sources report, a day at a time, with the things the brand did drawn on the same days. Use it to see what moved after a post, a stream or a sale, and how sure you can be that it was that.
Open Numbers in the sidebar, under Measure. Anyone who can see the brand can read it. Importing a file needs an Editor or above (see Importing numbers).
Where the figures come from
Marketing pulls from each of the brand's sources once a day. A brand with nothing yet sees No numbers yet. Connect the brand's accounts, link what it markets, or import a file, and the figures appear after the next daily pull.
| Source | What it gives | What it needs |
|---|---|---|
| Tracked links | Link clicks, and an estimate of unique visitors for each link | Nothing to connect. Counted whenever someone follows one of your short links (see Links) |
| Websites | Page views and website visits, by page, referrer and campaign | A website with analytics set up (see Websites) |
| YouTube | Views, watch time, subscribers gained and lost | A YouTube connection with the use Read post insights, and the permissions in Connect YouTube |
| Twitch | Followers, subscribers, views of clips and past broadcasts, new follows and raids | A Twitch connection. Subscribers need the extra permission in Connect Twitch |
| Social networks | Engagement with recent posts | Posts that went out through a connected account, on a network that reports it |
| Live streams | Streams, time streamed, peak and average viewers, chat messages | Streams made in Live |
| Press and creators coverage | Coverage published, views gained | Coverage logged under Press and creators |
| Ads | Spend, impressions, clicks, conversions, cost per click | A connection with the use Read ads |
| Steam sales, Steam wishlists, Google Play, App Store, Players | Sales, wishlist actions, installs, downloads, active players | A brand that markets a game, and for the stores a connection with the use Read metrics (see Store numbers) |
| Imported files | Whatever the file holds | An import (see Importing numbers) |
Pulls from YouTube, Twitch, the social networks, ads and the stores use your org's credits, once a day for each source. The rest are free. The page does not show a price for a pull; see Credits for how credits work. If an org has no credits left, those sources are skipped until it does, and the Sources list says so.
Read the chart
- Choose a Figure. The list reads source: figure, such as Tracked links: Link clicks. A figure the brand has no data for yet is marked (nothing yet).
- Choose Broken down by to split the figure. It starts at All. The other choices are named as the source reports them, such as
campaign:lanternfall-launchornetwork:bluesky. - Choose how many days to show: 30 days, 90 days, 180 days or 365 days.
- Hover or tap a day to read its figure. Show as a table gives the same days as rows.
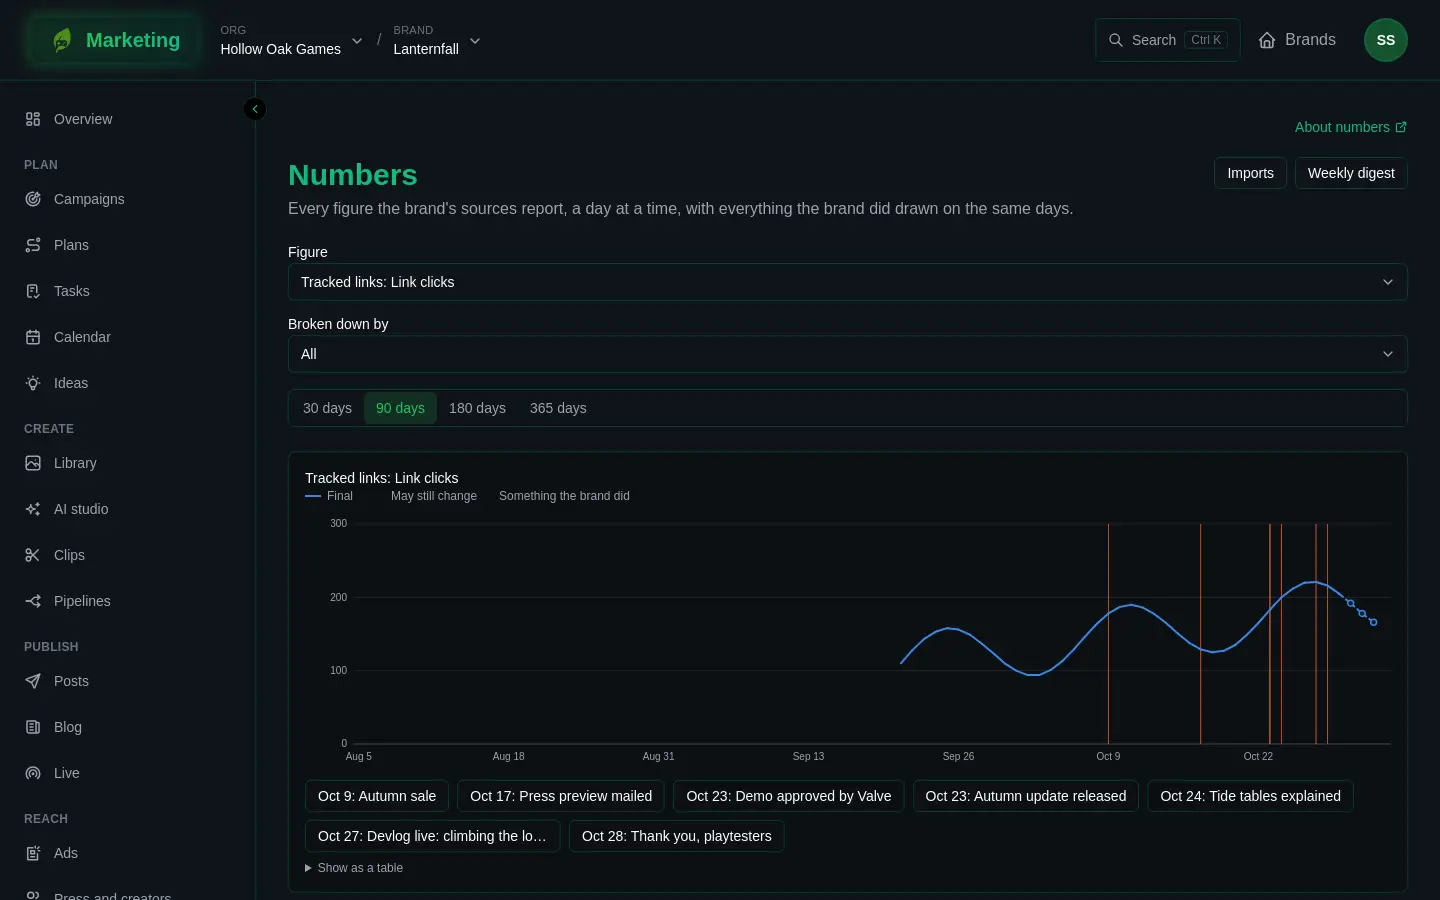
Dashed lines and gaps
A solid line is a day the source will not change again, marked Final in the key. A dashed line with hollow dots is May still change. Sources correct their own figures for a while: Steam recalculates its sales after the day is over, and ad conversions can take weeks to settle. The newest days are nearly always dashed.
A day nobody reported is a gap in the line, never a zero. A source that was not connected yet, or a failed pull, leaves a gap too.
Followers and other levels
Figures such as followers, subscribers and engagement with recent posts are a level, read once a day as it stands. The chart starts on the first day Marketing read it, and cannot go back before that.
Events on the chart
Everything the brand did is drawn as a vertical line on the days it happened: posts that went out, streams, plan milestones and goal days, ad campaigns started or paused and budgets changed, coverage published, and for a brand that markets a game, changes to its Steam page, price and discounts. Events in this range lists them as buttons, each with its day and title.
Around an event
Choose an event from Events in this range. The panel Around an event compares the days after it with what the weeks before suggest would have happened, each day against the same weekday. The chart adds a dotted line, Expected from the weeks before.
The panel gives one of three verdicts: Above what was expected, Below what was expected or Within the usual ups and downs. Beside it are What happened, What was expected, Difference and Likely range. If there are too few days before the event, or no figures yet for the days after, the panel says so instead.
This shows correlation, not cause. Anything else that happened in those days moves the numbers too. The page says so beside the panels.
Across a campaign
In Across a campaign, choose a Campaign to add up the lift of all its events on the figure you are looking at. If some of its events are close together, some days count towards more than one of them, and the panel tells you. See Campaigns.
Shared channels
A brand that borrows a Twitch channel from another brand, or lends one, gets two more lists: From channels this brand borrows and Channels this brand lends. A borrowed line is what happened on the channel during this brand's stream or just after its post. It is an attribution, not a count, so it is never added to anything. See Sharing.
Sources
Sources lists every source the brand has, failing ones first, with when it was last pulled. A badge says how it went:
- Up to date: the last pull worked.
- Failing: the last pull failed. The reason is under the name.
- Not running: it was skipped, for example because the org is out of credits.
- Not run yet: it has not been pulled since it was added.
- Not connected: nothing is connected for it yet. This is not a fault. Connect it on the Connections page and its figures are read each day.
If it goes wrong
Figures that are missing, late, or marked as failing are covered in Number problems.