Analytics
Analytics is where you read how the brand is doing: its key figures against the period before, what it published and what each thing got, how each network, campaign and pipeline did, where its audience is, and its links and websites.
Open Analytics in the sidebar, under Measure. Anyone who can see the brand can read it. Sources, under it, lists where the figures come from and takes imported files (see Importing numbers).
The period
The header shows the days you are looking at, and the days it compares them with. Choose 7 days, 28 days, 90 days or Last week (Monday to Sunday). It starts on 28 days. The days end yesterday, since most sources have not reported today yet.
Compare with the period before draws the same number of days just before as a faint line behind the chart, and each figure says how it changed. Switch it off to see the period on its own.
The tab, the period and anything open beside the page are part of the address, so you can send someone a link to exactly what you see.
Overview
The tiles at the top are the brand's key figures. Each shows the period's figure, its change against the period before, and a small line of its days. Views and Engagement come first: they add up what each network reports. Each network counts in its own way, so compare a network with itself over time rather than with another. Each network's part under the chart opens the split beside the page.
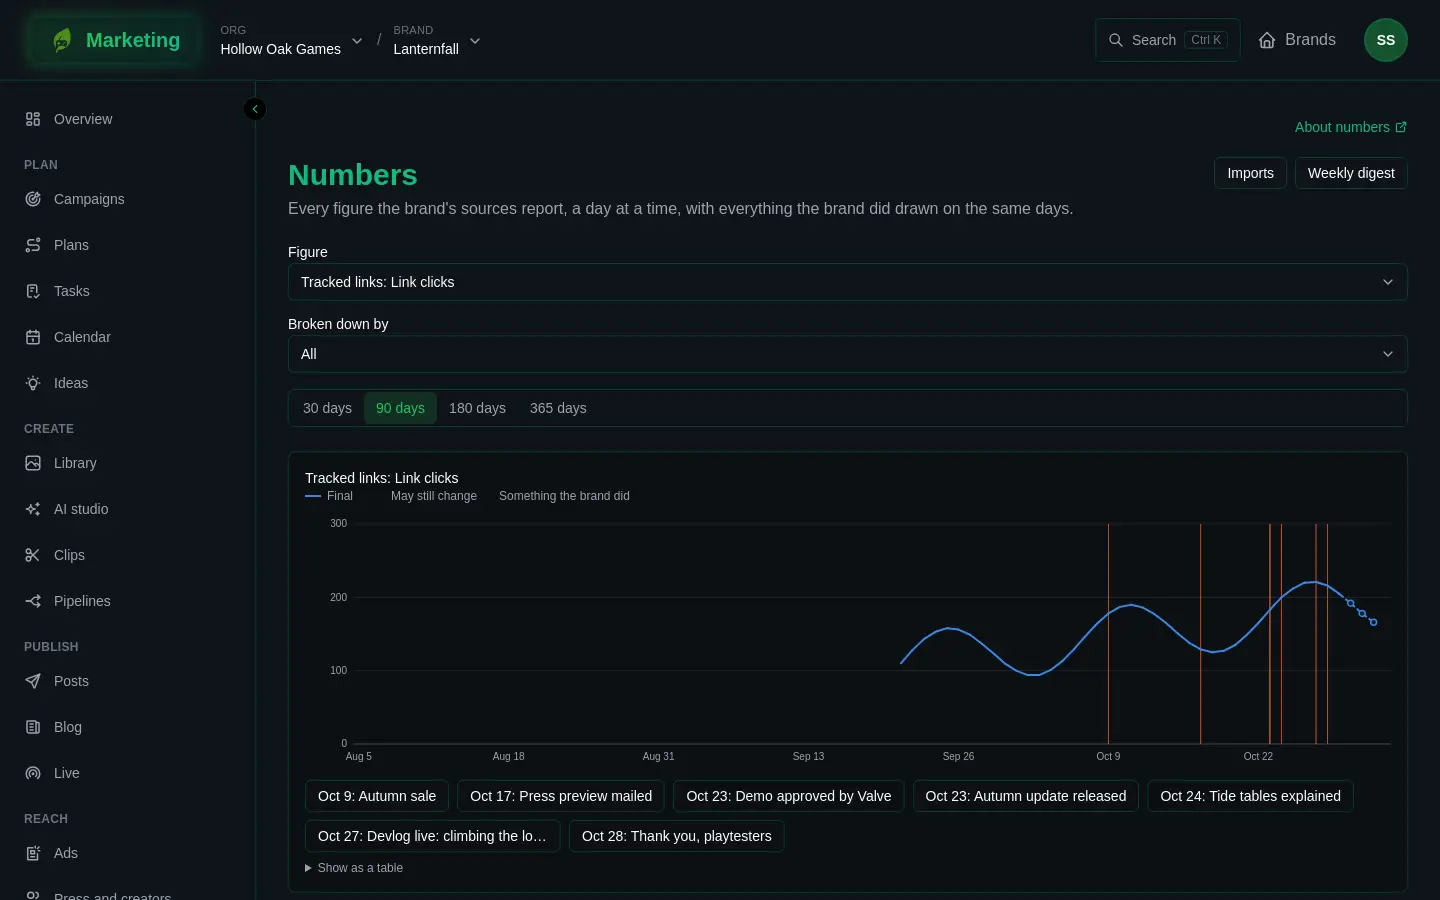
Tap a tile to chart it. Choose a figure charts any other figure the brand has, such as one source's figure on its own. The events under the chart are what the brand did on those days; tap one to see how the charted figure moved after it (see Numbers).
Under the chart, What's working gives the clearest findings in plain words, and Top content the period's best posts and stream.
Content
Everything the brand published in the period: posts and clips with their views, engagement, link clicks and how they did against their account's usual, streams with the most people watching at once and their chat, and blog posts. Filter by kind, or by channel. A post counts in the period its first channel went out in, with what it has got since.
Tap a row to see its numbers an hour, a day, a week and a month after it went out on each channel, its links and the findings it matches. A gap means the network gives no such number; it is never a zero.
Under the table, What goes with better results is the full list of findings (see What's working).
Channels
One row per network: followers now and their change, the posts that went out on it, their engagement, how they did against the account's usual, and clicks on their links. Tap a row for its followers over the period, how quickly its posts gather their results, each account's usual, and what goes with better results there. Shared channels shows what the brand borrows and lends (see Sharing).
Campaigns
One row per campaign that ran or posted in the period, with its dates, its posts, the figures your sources count by campaign (link clicks, website visits, a store's visitors, ad spend) and the combined lift of its events on the brand's first key figure. Ad spend shows only to people who can see Ads. Tap a row for everything the campaign got, its posts, and a link to the campaign's own results.
Pipelines
One row per pipeline: runs, posts made, credits spent, how its posts did against the ones people made by hand, and its experiments. Each post is read against its own account's usual first, so a pipeline posting to a bigger account is not flattered by it. Tap a row for the pipeline's findings and experiments. This tab shows to people who can see pipelines.
Audience
Where your audience is, by country and time zone; the times and days that go with better results; and public holidays in the next four weeks in the audience's main countries.
Links
Clicks a day on every tracked link, each link with its clicks, estimated visitors and change, and clicks by country and by where they came from. Tap a link for its short address, its QR codes, switching it off, putting it on the link-in-bio page, and its own clicks by country and referrer. New link opens the builder beside the page (see Links). The link-in-bio page is at the bottom.
Websites
Visits and page views a day, each site's figures, and the top pages, referrers, and UTM sources and campaigns across the brand's sites. Set up websites opens the list of sites, the snippet and setting up beside the page (see Websites); Open analytics opens the sites' own analytics.
Sources and the weekly digest
Sources in the header says how many sources are failing and opens how each last went. The Sources page under Analytics has the same list, what to connect for each, and imports. Weekly digest sends you a notice each Monday about the week before, which opens Analytics on that week (see Weekly digest).